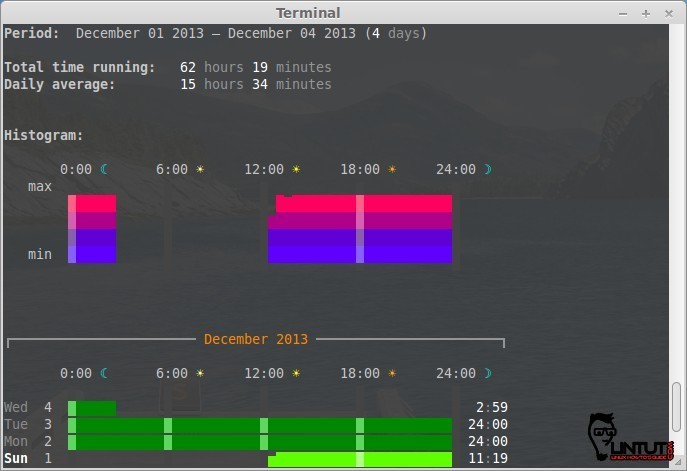
Ranwhen is an interesting Python script that displays in a terminal useful details about the user’s computer/system, while retaining an easily-graspable attitude. It displays information about the total running time and daily average in a very beautiful histogram.
Running the script, the user is to notice a histogram with usage patterns filtered through the main hours of the day, including 6:00, 12:00, 24:00, periods of time detailed with fancy color tones.
Moreover, Ranwhen presents in the terminal the current month’s in-depth details about the system’s usage, thus allowing the user to observe how the computer has been used.
Requirements
- *nix system with last installed and supporting the -R and -F flags
- Python >= 3.2
- Terminal emulator with support for Unicode and xterm’s 256 color mode
The above requirements should be fulfilled by default on the majority of modern Linux distributions, where the only thing that needs to be done is usually to install Python 3.
Install Python 3.2
# sudo apt-add-repository ppa:fkrull/deadsnakes
# sudo apt-get update
# sudo apt-get install python3.2
Installing and using ranwhen
Download and unzip the Ranwhen archive:
# wget https://github.com/p-e-w/ranwhen/archive/master.zip
# unzip master.zip
# cd ranwhen-master
Run Ranwhen in terminal:
# ./ranwhen.py