

The top program provides a dynamic real-time view of a running system. It can display system summary information as well as a list of processes or threads currently being managed by the Linux kernel. The types of system summary information shown and the types, order and size of information displayed for processes are all user configurable and that configuration can be made persistent across restarts.
In this tutorial, I will provide you a general information about the top command.
How to execute top command
To execute top command just open your terminal window and after writing top hit enter.
# top
After executing the command you will able to see a screen like below

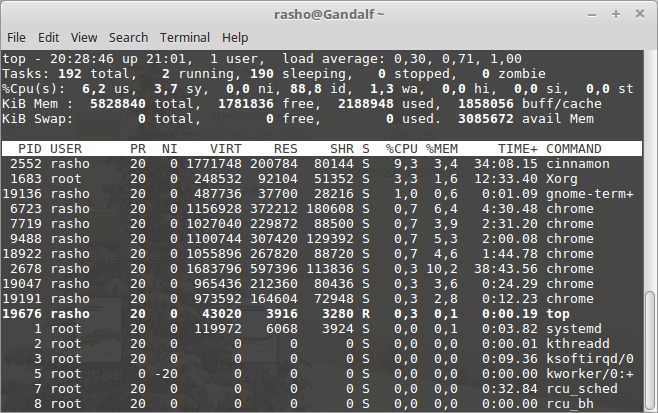
Now we will learn what is the meaning of these outputs.
The first line of the result gives you the following information:
![]()
– uptime of the machine (up 21:01)
– users sessions logged in (1 users)
– average load on the system (load average: 0.30, 0.71, 1.00) the 3 values refer to the last minute, five minutes and 15 minutes.

The second row gives the following information:
![]()
– Processes running (1 running)
– Processes sleeping (190 sleeping)
– Processes stopped (0 stopped)
– Processes waiting to be stopped from the parent process (0 zombie).

The third line indicates how the CPU is used. If you sum up all the percentages the total will be 100% of the CPU. Let’s see what these values indicate in order:
![]()
– Percentage of the CPU for system processes (3.7%sy)
– Percentage of the CPU processes with priority upgrade nice (0.0%ni)
– Percentage of the CPU not used (88.8%id)
– Percentage of the CPU processes waiting for I/O operations(1.3%wa)
– Percentage of the CPU serving hardware interrupts (0.0%hi) — Hardware IRQ
– Percentage of the CPU serving software interrupts (0.0%si) — Software Interrupts
– The amount of CPU ‘stolen’ from this virtual machine by the hypervisor for other tasks (such as running another virtual machine) this will be 0 on desktop and server without Virtual machine. (0.0%st — Steal Time).

The fourth and fifth rows respectively indicate the use of physical memory (RAM) and swap. In this order: Total memory in use, free, buffers cached.
![]()

Below are some shortcuts for top commands. Use these while running the top command.
l –To display or to hide load average line
t –To display or to hide task/cpu line
1 –To display or hide all other CPU’s
m –to display or to hide RAM and SWAP details
s –To change the time interval for updating top results(value is in sec’s)
R –To sort by PID number
u — Press u then username to get only that user process details
P –To sort by CPU utilization
M –To sort by RAM utilization
c –To display or hide command full path
r –To renice a process, press r then the PID no then the renice value to renice a process.
k –To kill a process, press k then PID number then enter to kill a process
w –To save the modified configuration permanently.
q –To quit the top command.
h –for getting help on the top command