

In a shared memory environment, which is a technique used by most operating systems, there is a challenge of counting the memory several times. This ends up giving users and system administrators inaccurate information on how physical memory is used.
smem is a tool that can give numerous reports on memory usage on Linux systems. Unlike existing tools, smem can report proportional set size (PSS), which is a more meaningful representation of the amount of memory used by libraries and applications in a virtual memory system.
Because large portions of physical memory are typically shared among multiple applications, the standard measure of memory usage known as resident set size (RSS) will significantly overestimate memory usage. PSS instead measures each application’s “fair share” of each shared area to give a realistic measure.
smem features
- system overview listing
- listings by process, mapping, user
- filtering by process, mapping, or user
- configurable columns from multiple data sources
- configurable output units and percentages
- configurable headers and totals
- reading live data from /proc
- reading data snapshots from directory mirrors or compressed tarballs
- lightweight capture tool for embedded systems
- built-in chart generation
smem has a few requirements:
a reasonably modern kernel (> 2.6.27 or so)
a reasonably recent version of Python (2.4 or so)
the matplotlib library for chart generation (optional, auto-detected)
Install smem in Linux
Most of the distributions (Debian, Ubuntu, Mint, Fedora, CentOS RHEK, etc.) has the smem package so, we can easily install it from distribution official repository. For RHEL/CentOS enable epel repository.
[Install smem on CentOS/RHEL]
$ sudo yum install smem
$ sudo yum install python-matplotlib

[Install smem on RHEL/CentOS]
$ sudo yum install smem
$ sudo yum install python-matplotlib

[Install smem on Fedora]
$ sudo dnf install smem
$ sudo dnf install python-matplotlib

[Install smem on Debian/Ubuntu]
$ sudo apt-get install smem
$ sudo apt-get install python-matplotlib

[Install smem on Mageia]
$ sudo urpmi smem
$ sudo urpmi python-matplotlib
How to use smem command
Use smem command without any options
After successfully smem installed with help of above command. Just fire the below command on terminal to mesure memory usage.
rasho@Gandalf ~ $ smem
  PID User     Command                         Swap      USS      PSS      RSS
 2627 rasho    /usr/sbin/rfkill event             0      100      113     1352
 2775 rasho    cat                                0       96      152     1816
 2776 rasho    cat                                0      100      153     1764
 2715 rasho    sh -c /usr/lib/linuxmint/mi        0      240      254     1572
 2567 rasho    syndaemon -i 1.0 -t -K -R          0      316      365     2636
 2415 rasho    /usr/bin/dbus-launch --exit        0      436      486     2580
 2434 rasho    /usr/bin/dbus-daemon --conf        0      500      625     4024
 2429 rasho    /usr/lib/at-spi2-core/at-sp        0      672      825     6076
 2788 rasho    /usr/lib/x86_64-linux-gnu/g        0      716      865     5552
 2517 rasho    /usr/lib/dconf/dconf-servic        0      796      874     4992
 2538 rasho    /usr/lib/gvfs/gvfs-goa-volu        0      780      880     5540
 2560 rasho    /usr/lib/gvfs/gvfs-mtp-volu        0      772      885     5884
 2436 rasho    /usr/lib/at-spi2-core/at-sp        0      808      949     6564
 2644 rasho    /usr/lib/gvfs/gvfsd-metadat        0      856      972     6000
...........
Show the output in MB
By default memory usage output shows on KB which may get confuse, add k option with smem to get the ouput in MB.
rasho@Gandalf ~ $ smem -k
  PID User     Command                         Swap      USS      PSS      RSS
 2627 rasho    /usr/sbin/rfkill event             0   100.0K   113.0K     1.3M
 2775 rasho    cat                                0    96.0K   152.0K     1.8M
 2776 rasho    cat                                0   100.0K   153.0K     1.7M
 2715 rasho    sh -c /usr/lib/linuxmint/mi        0   240.0K   254.0K     1.5M
 2567 rasho    syndaemon -i 1.0 -t -K -R          0   316.0K   365.0K     2.6M
 2415 rasho    /usr/bin/dbus-launch --exit        0   436.0K   486.0K     2.5M
 2434 rasho    /usr/bin/dbus-daemon --conf        0   500.0K   624.0K     3.9M
 2429 rasho    /usr/lib/at-spi2-core/at-sp        0   672.0K   825.0K     5.9M
 2788 rasho    /usr/lib/x86_64-linux-gnu/g        0   716.0K   865.0K     5.4M
 2517 rasho    /usr/lib/dconf/dconf-servic        0   796.0K   874.0K     4.9M
 2538 rasho    /usr/lib/gvfs/gvfs-goa-volu        0   780.0K   880.0K     5.4M
 2560 rasho    /usr/lib/gvfs/gvfs-mtp-volu        0   772.0K   886.0K     5.7M
 2436 rasho    /usr/lib/at-spi2-core/at-sp        0   808.0K   949.0K     6.4M
 2644 rasho    /usr/lib/gvfs/gvfsd-metadat        0   856.0K   973.0K     5.9M
 2502 rasho    /usr/lib/gvfs/gvfsd                0   812.0K     1.1M     6.2M
 2785 rasho    /opt/google/chrome/chrome -        0   168.0K     1.1M    11.7M
.................
smem show total memory usage
Even the output shows in MB, to get the total memory with smem, add t option.
rasho@Gandalf ~ $ smem -kt
  PID User     Command                         Swap      USS      PSS      RSS
 2627 rasho    /usr/sbin/rfkill event             0   100.0K   113.0K     1.3M
 2775 rasho    cat                                0    96.0K   152.0K     1.8M
 2776 rasho    cat                                0   100.0K   153.0K     1.7M
 2715 rasho    sh -c /usr/lib/linuxmint/mi        0   240.0K   254.0K     1.5M
 2567 rasho    syndaemon -i 1.0 -t -K -R          0   316.0K   365.0K     2.6M
 2415 rasho    /usr/bin/dbus-launch --exit        0   436.0K   486.0K     2.5M
 2434 rasho    /usr/bin/dbus-daemon --conf        0   500.0K   624.0K     3.9M
 2429 rasho    /usr/lib/at-spi2-core/at-sp        0   672.0K   825.0K     5.9M
 2788 rasho    /usr/lib/x86_64-linux-gnu/g        0   716.0K   865.0K     5.4M
 2517 rasho    /usr/lib/dconf/dconf-servic        0   796.0K   874.0K     4.9M
 2538 rasho    /usr/lib/gvfs/gvfs-goa-volu        0   780.0K   880.0K     5.4M
 2560 rasho    /usr/lib/gvfs/gvfs-mtp-volu        0   772.0K   886.0K     5.7M
 2436 rasho    /usr/lib/at-spi2-core/at-sp        0   808.0K   949.0K     6.4M
 2644 rasho    /usr/lib/gvfs/gvfsd-metadat        0   856.0K   973.0K     5.9M
 2502 rasho    /usr/lib/gvfs/gvfsd                0   812.0K     1.1M     6.2M
 2785 rasho    /opt/google/chrome/chrome -        0   168.0K     1.1M    11.7M
.................
-------------------------------------------------------------------------------
   57 1                                           0     2.3G     2.5G     3.8G
Report memory usage by user
We can easily sort the memory usage based on the users by adding u option with smem command. By default memory usage output shows on KB which may get confuse, so i have added k option on every output which will shows the smem output in MB.
rasho@Gandalf ~ $ smem -uk
User     Count     Swap      USS      PSS      RSS
rasho       57        0     2.5G     2.6G     3.9G
Report systemwide memory usage summary
rasho@Gandalf ~ $ smem -wk
Area                           Used      Cache   Noncache
firmware/hardware                 0          0          0
kernel image                      0          0          0
kernel dynamic memory          2.0G       1.8G     187.0M
userspace memory               2.7G     676.9M       2.0G
free memory                  886.6M     886.6M          0
show memory usage in percentages
rasho@Gandalf ~ $ smem -p
 PID User     Command                         Swap      USS      PSS      RSS
 2627 rasho    /usr/sbin/rfkill event           N/A    0.00%    0.00%    0.02%
 2775 rasho    cat                              N/A    0.00%    0.00%    0.03%
 2776 rasho    cat                              N/A    0.00%    0.00%    0.03%
 2715 rasho    sh -c /usr/lib/linuxmint/mi      N/A    0.00%    0.00%    0.03%
 2567 rasho    syndaemon -i 1.0 -t -K -R        N/A    0.01%    0.01%    0.05%
 2415 rasho    /usr/bin/dbus-launch --exit      N/A    0.01%    0.01%    0.04%
 2434 rasho    /usr/bin/dbus-daemon --conf      N/A    0.01%    0.01%    0.07%
 2429 rasho    /usr/lib/at-spi2-core/at-sp      N/A    0.01%    0.01%    0.10%
...................................
Report memory usage by mapping
rasho@Gandalf ~ $ smem -p
Map                                       PIDs   AVGPSS      PSS
/dev/nvidia0                                 3        0        0
/usr/lib/x86_64-linux-gnu/gconv/gconv-mo    33        0        0
/usr/lib/x86_64-linux-gnu/girepository-1     7        0        0
/usr/lib/x86_64-linux-gnu/girepository-1     6        0        0
/usr/lib/x86_64-linux-gnu/girepository-1     6        0        0
/usr/share/locale-langpack/en/LC_MESSAGE    11        0        0
/var/cache/fontconfig/0c9eb80ebd1c36541e     9        0        0
/var/cache/fontconfig/0d8c3b2ac0904cb8a5     9        0        0
/var/cache/fontconfig/14a5e22175779b556e     9        0        0
/var/cache/fontconfig/16c2fda60d1b4b719f     9        0        0
/var/cache/fontconfig/1ac9eb803944fde146     9        0        0
/var/cache/fontconfig/2171a34dccabdb6bcb     9        0        0
/var/cache/fontconfig/22368d551a680bfe5a     9        0        0
/var/cache/fontconfig/30829fa25452a46451     9        0        0
.......................
smem numeric output
rasho@Gandalf ~ $ smem -nk
  PID User     Command                         Swap      USS      PSS      RSS
 2627 1000     /usr/sbin/rfkill event             0   100.0K   113.0K     1.3M
 2775 1000     cat                                0    96.0K   152.0K     1.8M
 2776 1000     cat                                0   100.0K   153.0K     1.7M
 2715 1000     sh -c /usr/lib/linuxmint/mi        0   240.0K   254.0K     1.5M
 2567 1000     syndaemon -i 1.0 -t -K -R          0   320.0K   369.0K     2.6M
 2415 1000     /usr/bin/dbus-launch --exit        0   436.0K   486.0K     2.5M
 2434 1000     /usr/bin/dbus-daemon --conf        0   504.0K   628.0K     3.9M
 2429 1000     /usr/lib/at-spi2-core/at-sp        0   672.0K   825.0K     5.9M
 2788 1000     /usr/lib/x86_64-linux-gnu/g        0   716.0K   865.0K     5.4M
 2517 1000     /usr/lib/dconf/dconf-servic        0   796.0K   874.0K     4.9M
 2538 1000     /usr/lib/gvfs/gvfs-goa-volu        0   780.0K   880.0K     5.4M
 2560 1000     /usr/lib/gvfs/gvfs-mtp-volu        0   772.0K   886.0K     5.7M
 2436 1000     /usr/lib/at-spi2-core/at-sp        0   808.0K   949.0K     6.4M
 2644 1000     /usr/lib/gvfs/gvfsd-metadat        0   856.0K   973.0K     5.9M
smem generating graphical output
It is also possible with smem to generate a graphical chart to show memory usage. Follow the below steps to generate the graphical output.
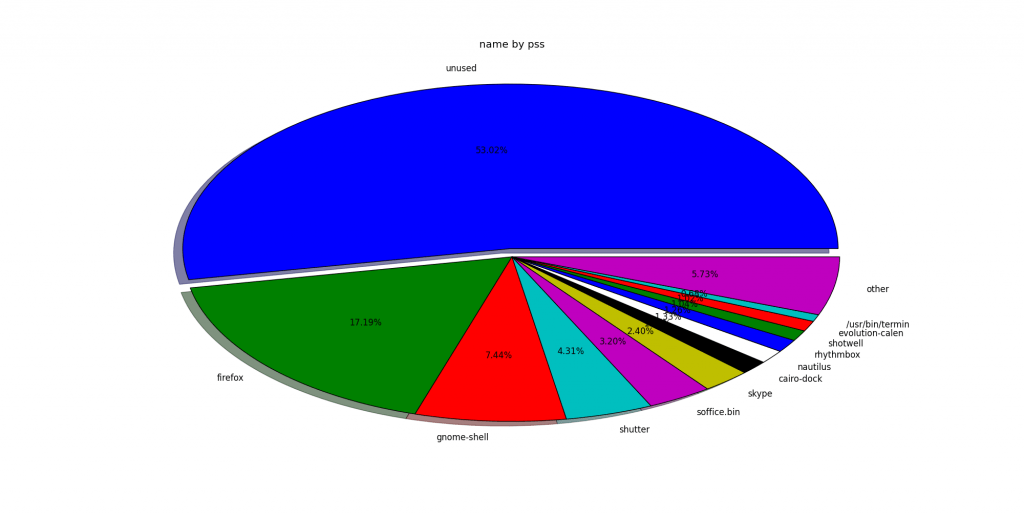
Smem generate pie chart
You can now view memory usage(USS, PSS and RSS) in form of a pie by using smem as follows:
rasho@Gandalf ~ $ smem --pie name -s uss

If you want to know more option which is available for smem, simply navigate to man page.
rasho@Gandalf ~ $ smem --help
or
~ $ man smem