

Splunk is a powerful log database that can be used for searching, monitoring, and analyzing machine-generated big data through a web-interface. It is a very useful tool for analyzing, exploring and searching data. You can easily index, search, collect and visualize massive data streams in real-time from an application, web server, database, server platform, Cloud-network and many more using Splunk.
In addition, splunk supports a wide range of log management use cases such as log consolidation and retention, security, IT operations troubleshooting, application troubleshooting as well as compliance reporting and so much more.
In this tutorial, we will be going to learn how to install Splunk log analiyer and how to add a log file and search through it for events in CentOS 7 server.
Splunk Features
- It’s easily scalable and fully integrated.
- Supports both local and remote data sources.
- Allows for indexing machine data.
- Supports searching and correlating any data.
- Allows you to drill down and up and pivot across data.
- Supports monitoring and alerting.
- Also supports reports and dashboards for visualization.
- Provides flexible access to relational databases, field delimited data in comma-separated value (.CSV) files or to other enterprise data stores such as Hadoop or NoSQL.
- Supports a wide range of log management use cases and much more.
Install Splunk Log Analyzer on CentOS 7 Linux
First, download Splunk log analizer using wget command:
# wget -O splunk-7.1.2-a0c72a66db66-linux-2.6-x86_64.rpm 'https://www.splunk.com/bin/splunk/DownloadActivityServlet?architecture=x86_64&platform=linux&version=7.1.2&product=splunk&filename=splunk-7.1.2-a0c72a66db66-linux-2.6-x86_64.rpm&wget=true'
Once the download is completed, install the downloaded file using the following command:
# rpm -i splunk-7.1.2-a0c72a66db66-linux-2.6-x86_64.rpm

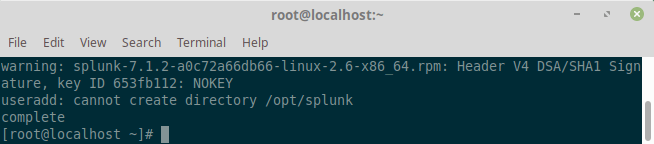
Next, use the Splunk Enterprise command-line interface (CLI) to start the service.
# /opt/splunk/bin/./splunk start
Here, you will need to agree to the License Agreement and provide admin password as below:
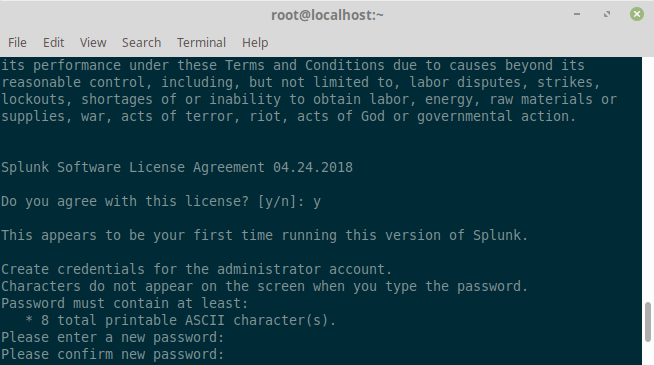
If all installed files are intact and all preliminary checks passed, the splunk server daemon (splunkd) will be started, a 2048 bit RSA private key will be generated and you can be able to access the splunk web interface.

Configure Firewall
Splunk Log Analyzer can be accessed on port 8000. If you have a firewall running on your system then you will need to allow port 8000 to be accessed from outside network. Run the following commands to allow port 8000 through the firewall:
# firewall-cmd --add-port=8000/tcp --permanent
# firewall-cmd --reload
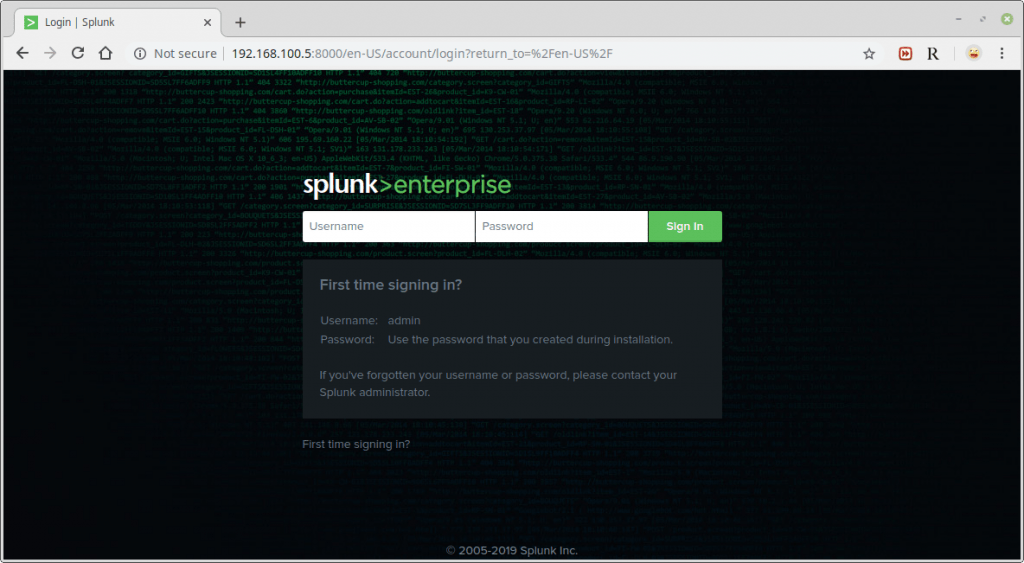
Access Splunk Log file analizer web interface
Now you can access your Splunk Web interface at http://IP:8000/ or http://hostname:8000. To login, use Username: admin and the password you created during the installation process.

After a successful login, you will land in the splunk admin console shown in the following screenshot.

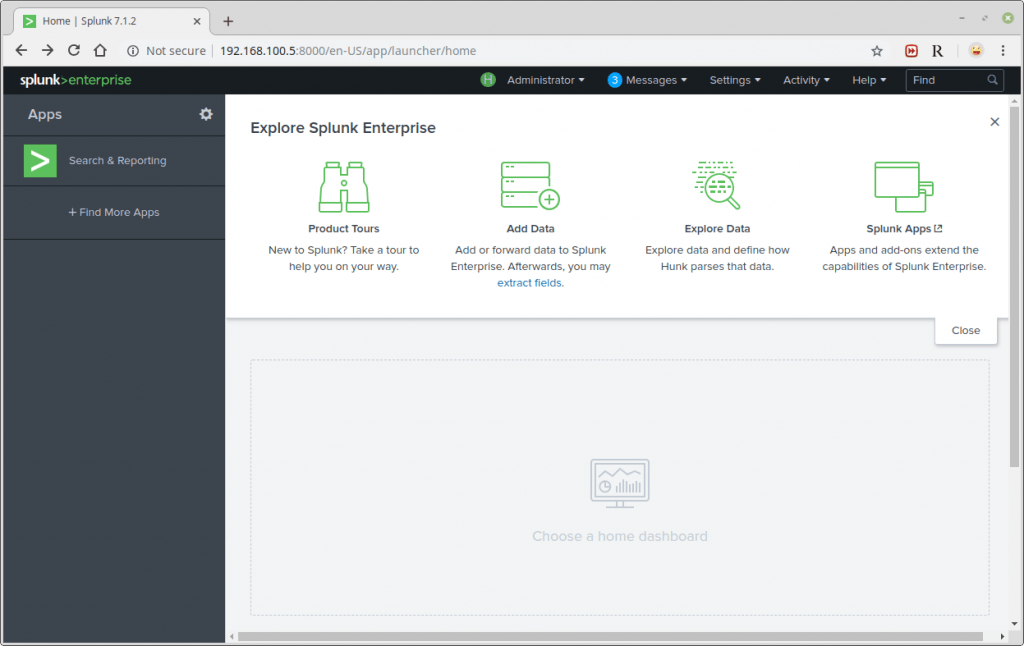
Then, click on Monitor to add data from a file.
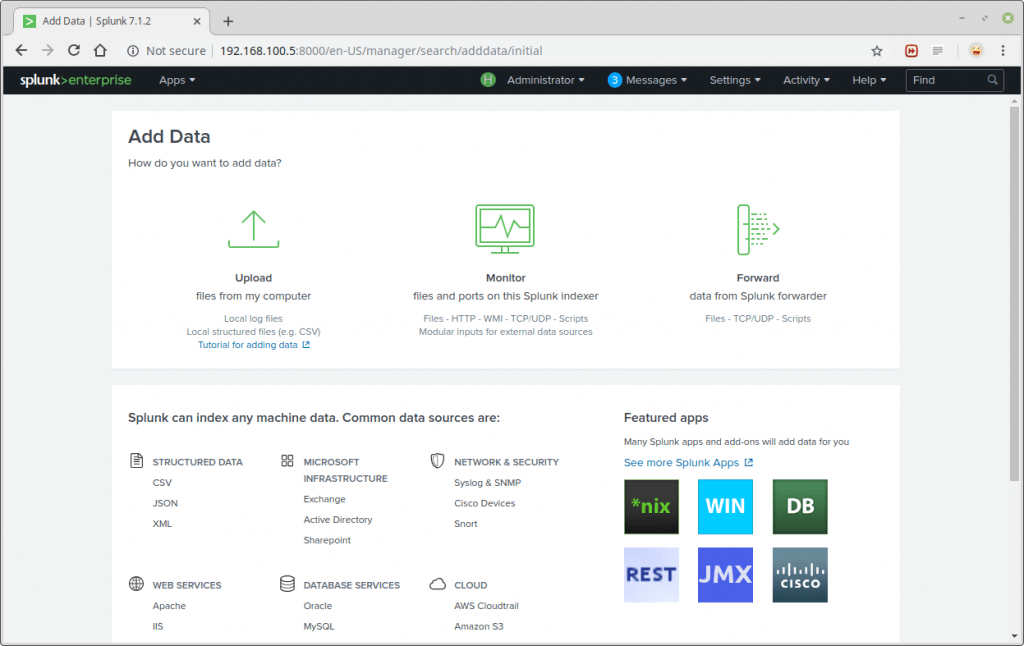
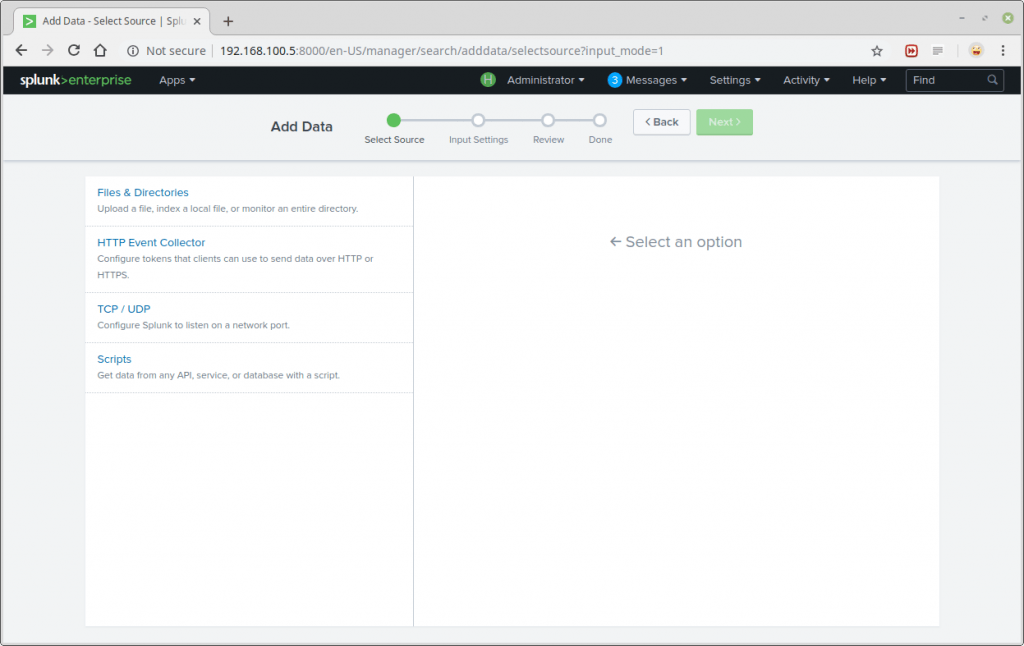
The Add Data Tab opens up with three options: Upload, Monitor and Forward. Here our task is to monitor a folder, so we go ahead with Monitor.
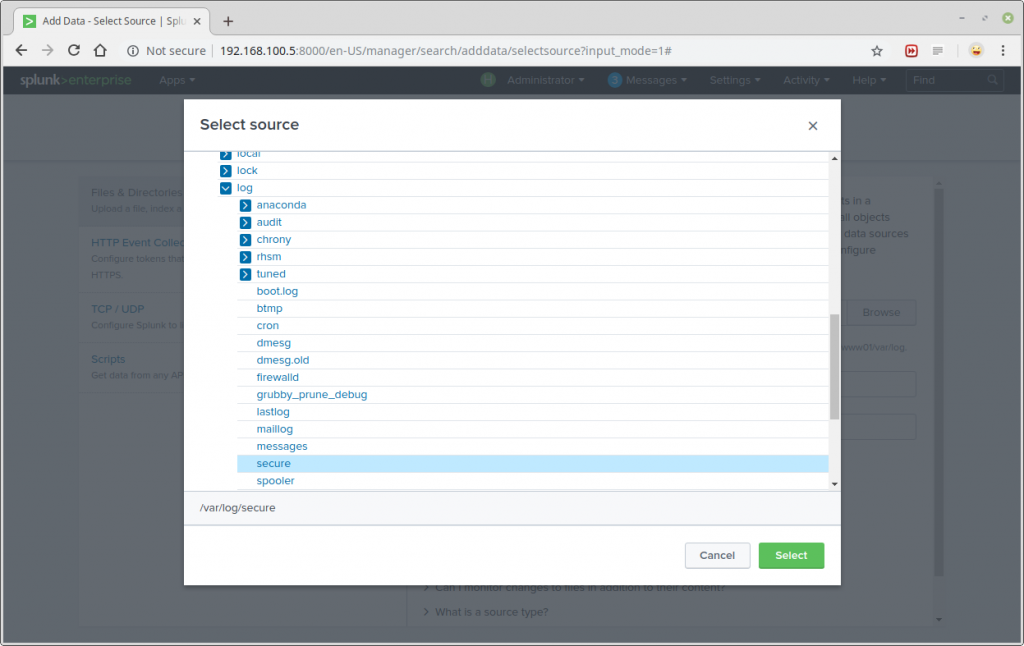
A list of directories in your root(/) directory will be shown to you, navigate to the log file you want to monitor (/var/log/secure) and click Select.
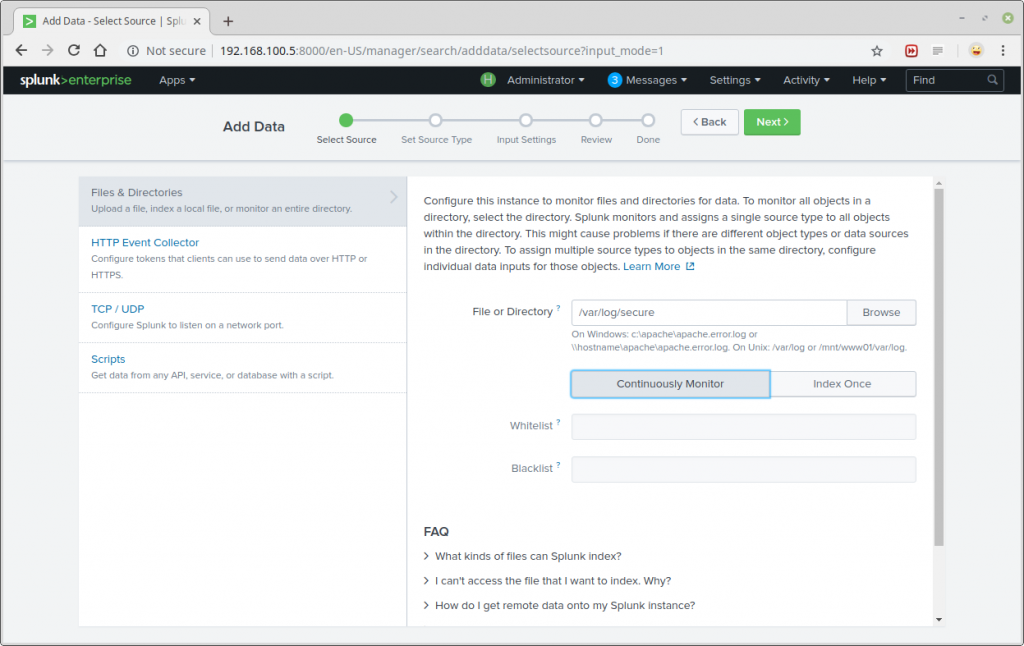
After selecting the data source, select Continuously Monitor to watch that log file and click on Next to set source type.
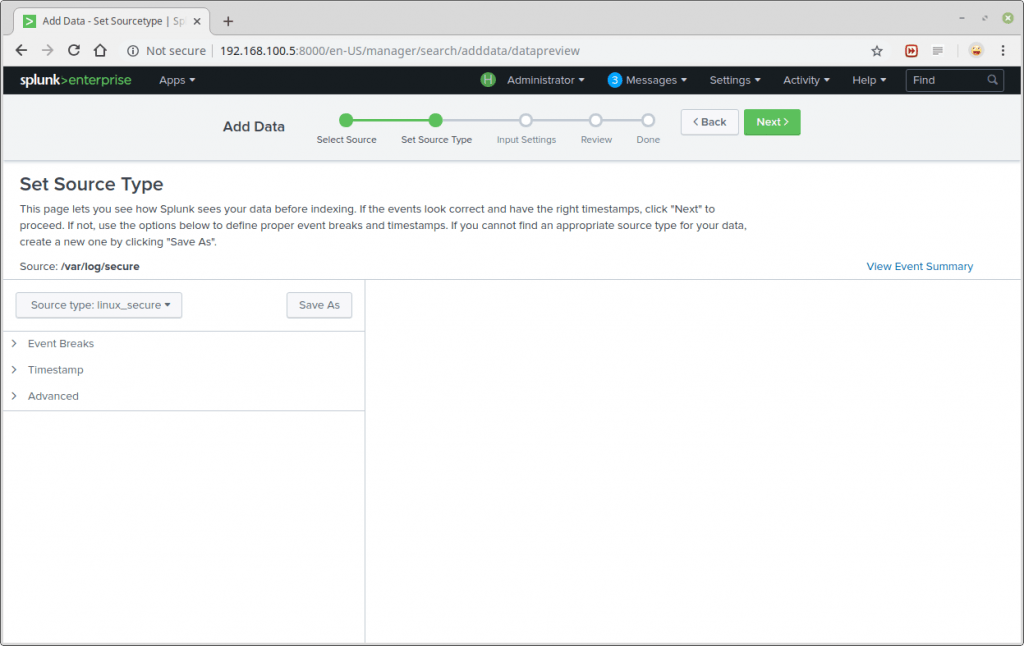
Next, set source type for your data source. For our test log file (/var/log/secure), we need to select Operating System→linux_secure; this lets splunk know that the file contains security related messages from a Linux system. Then click Next to proceed.
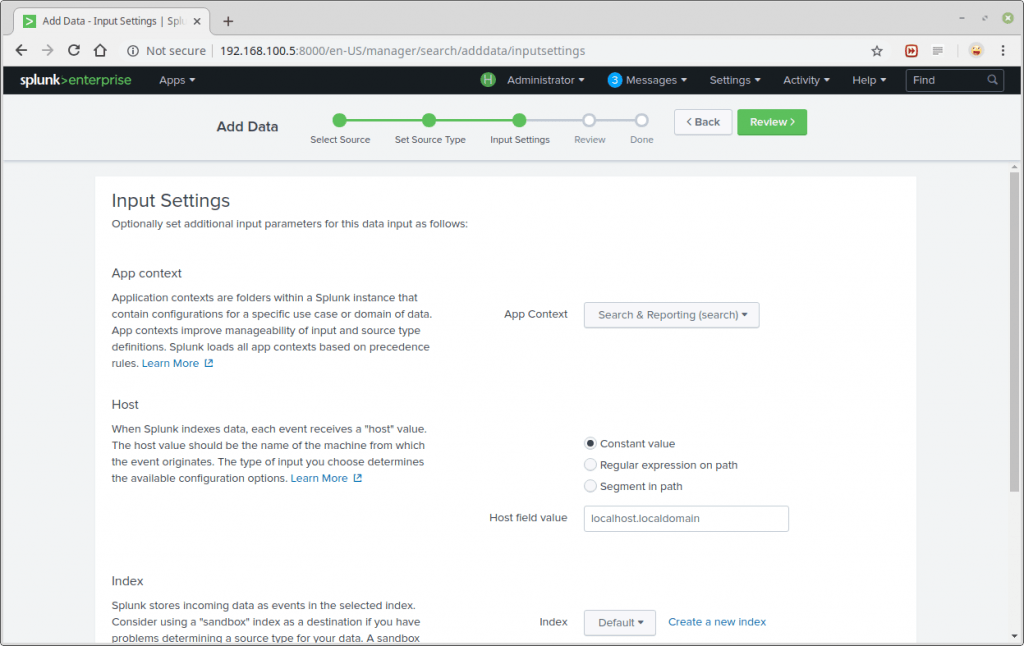
You can optionally set additional input parameters for this data input. Under App context, select Search & Reporting. Then click Review. After reviewing, click Submit.
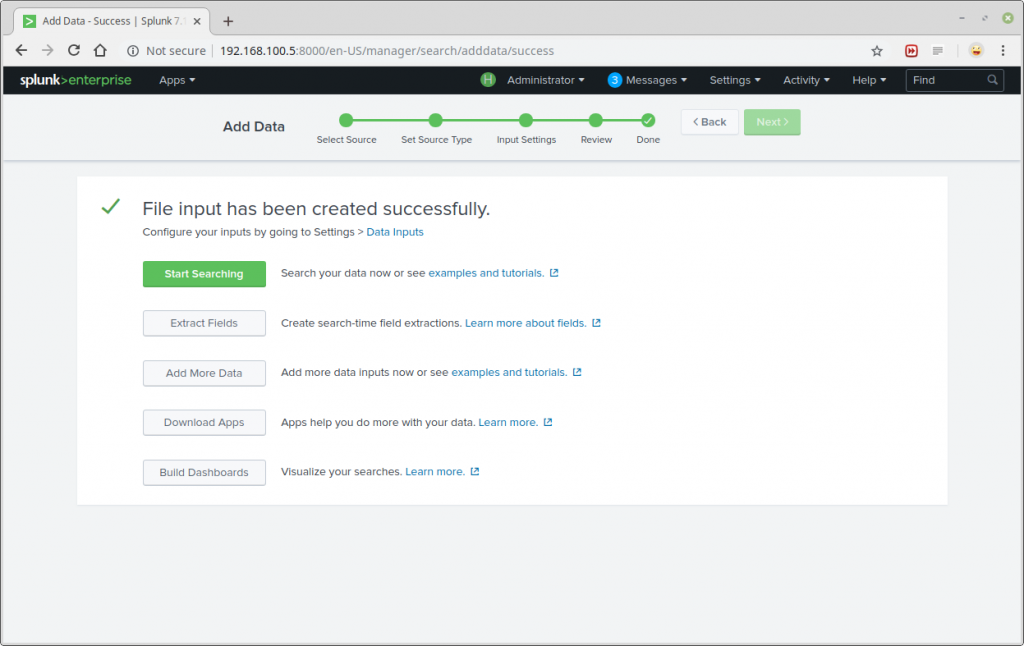
Now, you can start searching and monitoring the log file as required.
That is all!
Conclusion
This is just a simple example for Splunking, you can add as many tasks to this and explore your server data. I hope this article is informative and useful for you. Thank you for reading this I recommend your valuable suggestions and comments on this. Now just try Splunk!!