

Grafana is an open source, feature rich metrics dashboard and graph editor for Graphite, Elasticsearch, OpenTSDB, Prometheus, and InfluxDB. As an example, when using InfluxDB as your data source, data stored on InfluxDB will be visualized using Grafana Graphs.
In this tutorial, we will explain how to install Grafana on Ubuntu 18.04/18.10.
[box type=”info” align=”” class=”” width=””]An online demo is available for you to try before installing Grafana on your Linux distribution.
Demo URL: http://play.grafana.org/[/box]
Grafana Features
- Elegant graphics for data visualization.
- Fast and flexible graphs with numerous options.
- Dynamic and reusable dashboards.
- It’s highly extensible using hundreds of dashboards and plugins in the official library.
- Supports power user preferences.
- Supports multi tenancy, setup multiple independent organizations.
- Supports authentication via LDAP, Google Auth, Grafana.com, and Github.
- Supports notifications via Slack, PagerDuty, and more.
- Remarkably supports collaboration by allowing sharing of data and dashboards across teams and so much more.
Prerequisites
Before you begin, you will need the following:
- A virtual machine running on Ubuntu 18.04/18.10 server
- A non-root user with sudo privileges
If everything is set, then let’s start the installation process.
Installing Grafana
Grafana is not available in Ubuntu’s default repository. Therefore, to get started, you must add grafana repository to Ubuntu 18.04/18.10 system.
$ echo "deb https://packagecloud.io/grafana/stable/debian/ stretch main" | sudo tee -a /etc/apt/sources.list
$ curl https://packagecloud.io/gpg.key | sudo apt-key add -
Next, update the Grafana repository and install Grafana using the following command:
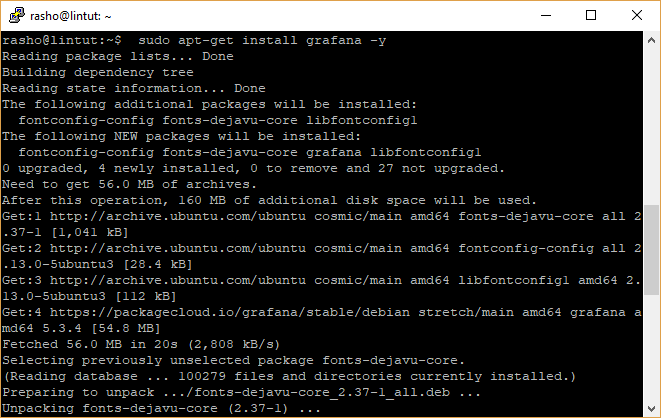
$ sudo apt-get update -y
$ sudo apt-get install grafana -y
After the installation process is complete, you will get an output similar to the one below:

After installing Grafana, you can find important files in the following locations:
- Installs binary to /usr/sbin/grafana-server
- Installs Init.d script to /etc/init.d/grafana-server
- Creates default file (environment vars) to /etc/default/grafana-server
- Installs configuration file to /etc/grafana/grafana.ini
- Installs systemd service name grafana-server.service
- The default configuration sets the log file at /var/log/grafana/grafana.log
- The default configuration specifies an sqlite3 db at /var/lib/grafana/grafana.db
- Installs HTML/JS/CSS and other Grafana files at /usr/share/grafana
Now, execute the commands below to start Grafana and enable it so that it starts on boot time:
$ sudo systemctl daemon-reload
$ sudo systemctl enable grafana-server
$ sudo systemctl start grafana-server
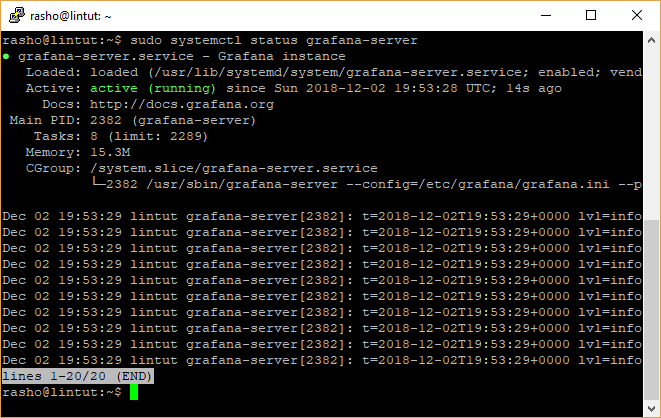
Go ahead and check Grafana status:
$ sudo systemctl status grafana-server
If your system has a firewall enabled by default, you need to open the port 3000 in the firewall to allow client requests to the grafana process.
$ sudo ufw allow 3000/tcp
$ sudo ufw reload
Access Grafana
Now that Grafana is fully installed and successfully configured, try to access its dashboard.
To do so, go to your browser and enter the address http://your-server-ip:3000. You should be directed to a new page that looks like the one below:

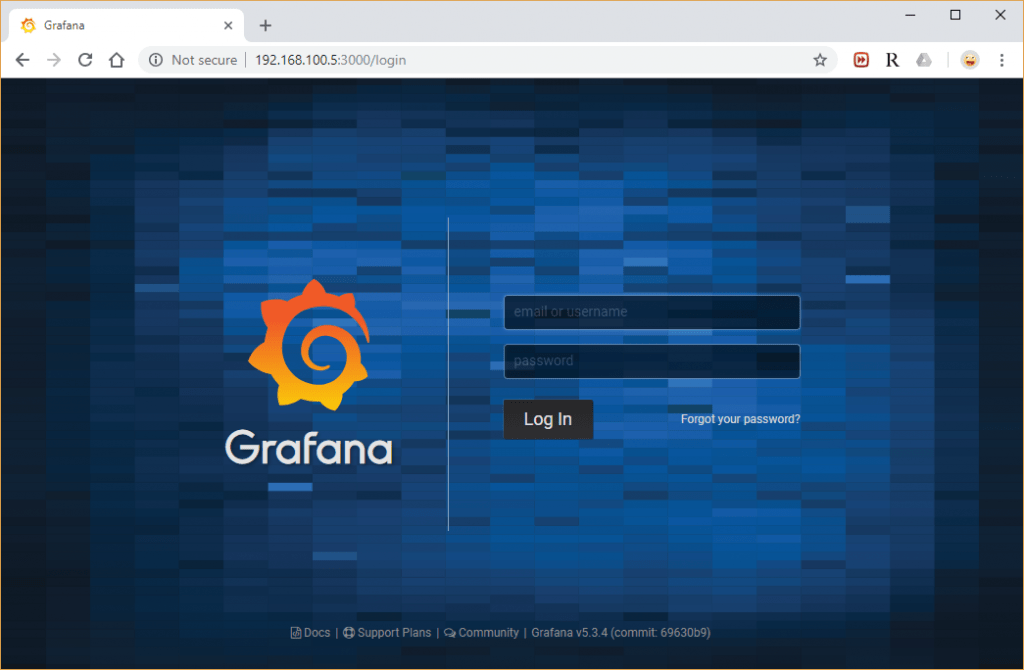
Now, provide your username as admin and password as admin, then click on the Log In button, you should see the Grafana dashboard in the following page:
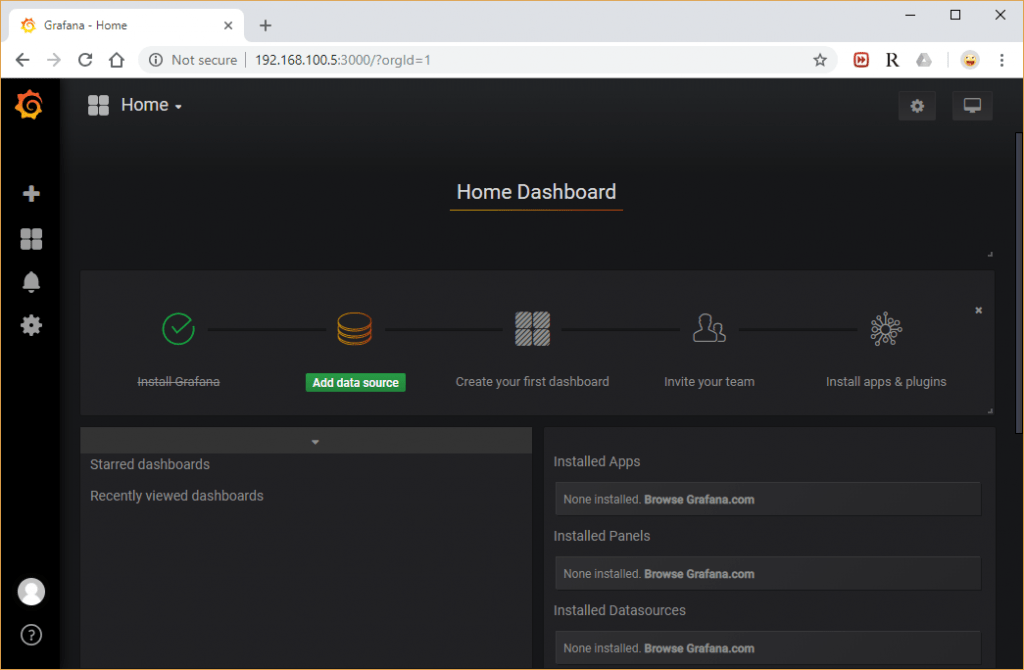
Now, everything is set and you have successfully installed Grafana monitoring tool on Ubuntu 18.04/18.10.
Conclusion
Congratulations! Grafana is now up and running and set to update you on what is happening with the systems and servers in your data center.
This monitoring system eliminates the guesswork on the actual activities taking place in your Linux machines as well as the services they offer. We hope it will be worth your time.