Glances is a cross-platform curses-based command line monitoring tool writen in Python which use the psutil library to grab informations from the system. Glance monitoring CPU, Load Average, Memory, Network Interfaces, Disk I/O, Processesand File System spaces utilization.
Glances can adapt dynamically the displayed information depending on the terminal siwrize. It can also work in a client/server mode for remote monitoring.
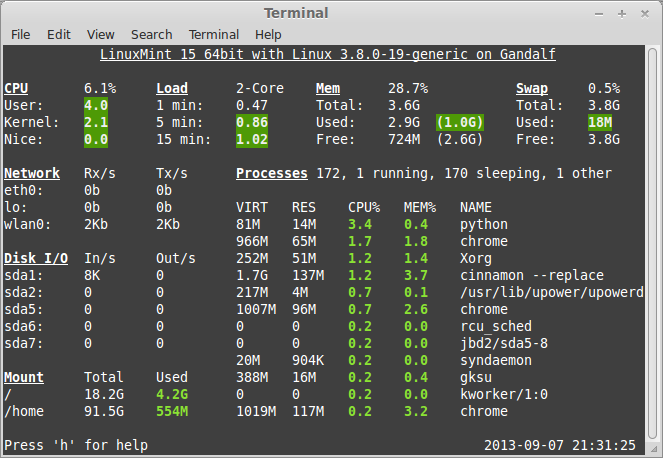
Glances Features
- CPU Informations (user related applications, system core programs and idle programs.
- Total memory Information including RAM, Swap, Free memory etc.
- The average CPU load for the past 1min, 5mins and 15 mins.
- Network Download/Upload rates of network connections.
- Total number of processes, active ones, sleeping processes etc.
- Disk I/O related (read or write) speed details
- Currently mounted devices disk usages.
- Top processes with their CPU/Memory usages, Names and location of application.
- Shows the current date and time at bottom.
- Highlights processes in Red that consumes highest system resources.
Requirements
- python >= 2.6 (tested with version 2.6, 2.7, 3.2, 3.3)
- psutil >= 0.4.1 (recommended version >= 0.6)
- jinja (optional for HTML output)
- pysensors (optional for HW monitoring support) [Linux-only]
- hddtemp (optional for HDD temperature monitoring support)
- batinfo (optional for battery monitoring support) [Linux-only]
- setuptools
Install Glances
Actually, packages exist for Arch Linux, Fedora / CentOS / RHEL, Debian (Sid/Testing) and Ubuntu (13.04+), so you should be able to install it using your favorite package manager.
In Ubuntu:
#sudo apt-get install glances -y
In Centos:
# yum install glances -y
Usage
Standalone mode
Simply run:
$ glances
Client/Server mode
If you want to remotely monitor a machine, called server, from another one, called client, just run on the server:
server$ glances -s
and on the client:
client$ glances -c @server
where @server is the IP address or hostname of the server.
In server mode, you can set the bind address -B ADDRESS and listening TCP port -p PORT.
In client mode, you can set the TCP port of the server -p PORT.
Default binding address is 0.0.0.0 (Glances will listen on all the network interfaces) and TCP port is 61209.
In client/server mode, limits are set by the server side.
You can also set a password to access to the server -P password.
Glances is IPv6 compatible. Just use the -B :: option to bind to all IPv6 addresses.
Glances Color Codes
Meaning of Glances color code:
- GREEN: OK (everything is fine)
- BLUE: CAREFUL (need attention)
- VIOLET: WARNING (alert)
- RED: CRITICAL (critical)
We can set thresholds in configuration file. By default thresholds set is (careful=50,warning=70 and critical=90), we can customized as per our needs. The default configuration file is located at ‘/etc/glances/glances.conf’.
More information on glances website


Wow, is that 3.4% load just for Glances? That’s not really practical to leave running, is it?
Nice article. I just installed it on my laptop. I found it better than gnome-system-monitor.
There’s a pseudo typo in Ubuntu install commande. It should be `$ sudo apt-get …`. You wont run sudo in root, would you?
I’d like to know how to install it in earlier debian and ubuntu releases. It isn’t present in the ones I’m running.