Dstat is a versatile replacement for vmstat, iostat, netstat and ifstat. Dstat overcomes some of their limitations and adds some extra features, more counters and flexibility. Dstat is handy for monitoring systems during performance tuning tests, benchmarks or troubleshooting.
Dstat allows you to view all of your system resources in real-time, you can eg. compare disk utilization in combination with interrupts from your IDE controller, or compare the network bandwidth numbers directly with the disk throughput (in the same interval).
Dstat gives you detailed selective information in columns and clearly indicates in what magnitude and unit the output is displayed. Less confusion, less mistakes. And most importantly, it makes it very easy to write plugins to collect your own counters and extend in ways you never expected.
Dstat’s output by default is designed for being interpreted by humans in real-time, however you can export details to CSV output to a file to be imported later into Gnumeric or Excel to generate graphs.
Features
- Combines vmstat, iostat, ifstat, netstat information and more
- Shows stats in exactly the same timeframe
- Enable/order counters as they make most sense during analysis/troubleshooting
- Modular design
- Written in python so easily extendable for the task at hand
- Easy to extend, add your own counters (please contribute those)
- Includes many external plugins to show how easy it is to add counters
- Can summarize grouped block/network devices and give total numbers
- Can show interrupts per device
- Very accurate timeframes, no timeshifts when system is stressed
- Shows exact units and limits conversion mistakes
- Indicate different units with different colors
- Show intermediate results when delay > 1
- Allows to export CSV output, which can be imported in Gnumeric and Excel to make graphs
Install dstat on Ubuntu 12.10/13.04/13.10/14.04 and Linux Mint 12/13/14/15/16
To install dstat on Ubuntu 12.10/13.04/13.10/14.04 and Linux Mint 12/13/14/15/16 enter following command:
# sudo apt-get install dstat
Install dstat on RHEL/CentOS 5.x/6.x and fedora 16/17/18/19/20
First, install rpmforge repository and enter folloving command:
# yum install dstat
Getting started with dstat
Now dstat should be installed and ready to display your systems performance stats.
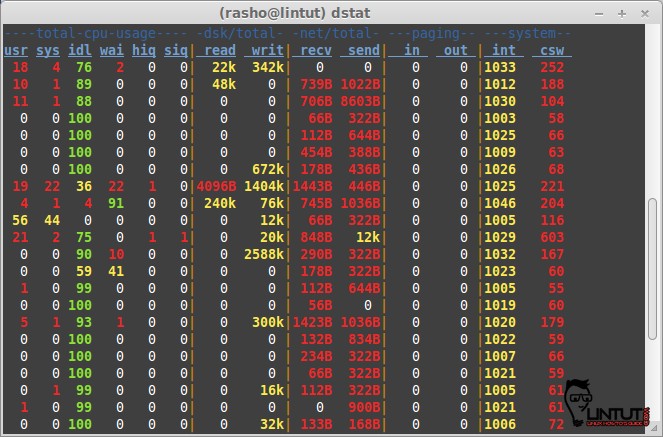
In its simplest form dstat can be invoked by issuing the command : dstat
# dstat
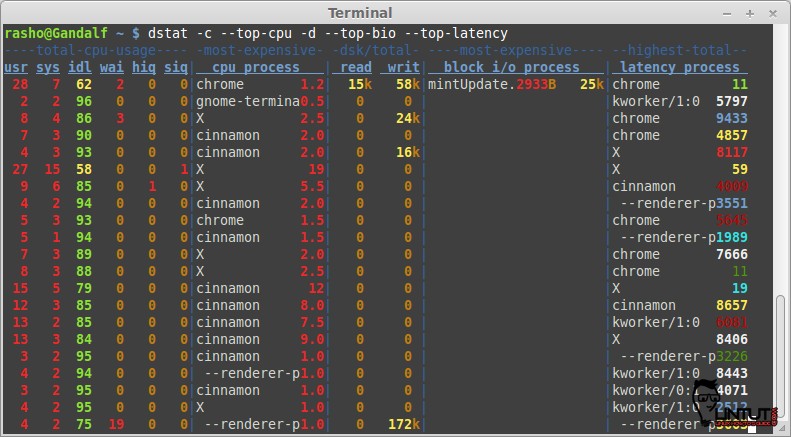
# dstat -c --top-cpu -d --top-bio --top-latency
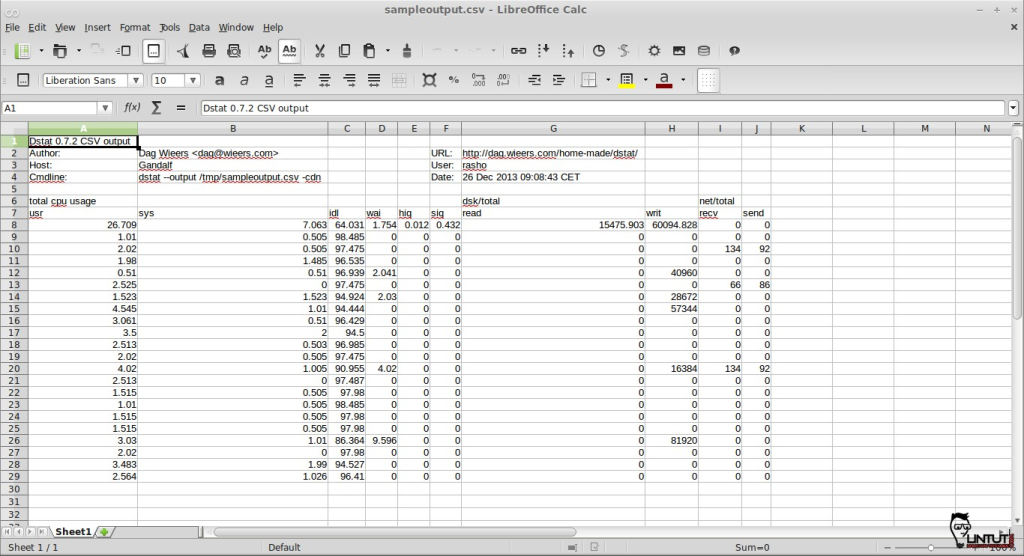
To send the output to a csv file for later use we can issue the following command:
# dstat --output /tmp/sampleoutput.csv -cdn
Other options available to dstat:
Dstat options:
- -c, –cpu enable cpu stats
- -C 0,3,total include cpu0, cpu3 and total
- -d, –disk enable disk stats
- -D total,hda include hda and total
- -g, –page enable page stats
- -i, –int enable interrupt stats
- -I 5,eth2 include int5 and interrupt used by eth2
- -l, –load enable load stats
- -m, –mem enable memory stats
- -n, –net enable network stats
- -N eth1,total include eth1 and total
- -p, –proc enable process stats
- -r, –io enable io stats (I/O requests completed)
- -s, –swap enable swap stats
- -S swap1,total include swap1 and total
- -t, –time enable time/date output
- -T, –epoch enable time counter (seconds since epoch)
- -y, –sys enable system stats
For a full list of all the options available, issue the command: dstat –help


Hello my friend! I want to say that this post is amazing, nice written and include almost all vital infos.
I’d like to see more posts like this .
Good stuff. Thanks.
Nice and practical article.
nice article. you could add some comparison with another tool called collectl is also quite versatile in terms of reporting multiple different system stats in a batch mode style.
Hi,
Thanks, this is very helpful.
I have one doubt.
I used -p, –proc enable process stats for getting process details. Along with process name there is soem value in %. Is that CPU utilization % against particular process at that instant?
Thanks,
mj