
Collectl is a light-weight performance monitoring tool capable of reporting interactively as well as logging to disk. It reports statistics on cpu, disk, infiniband, lustre, memory, network, nfs, process, quadrics, slabs and more in easy to read format.
In this article i will show you how to install and sample usage Collectl on Debian/Ubuntu and RHEL/Centos and Fedora linux.
Install collectl
Install collectl on Debian/Ubuntu Linux
In Debian/Ubuntu Collectl is available in the default repositories.
# sudo apt-get install collectl
Install collectl on RHEL/CentOS and Fedora Linux
To install Collectl on RHEL/CentOS, Fedora need to enable Epel repository.
# yum install collectl
Usage Collectl
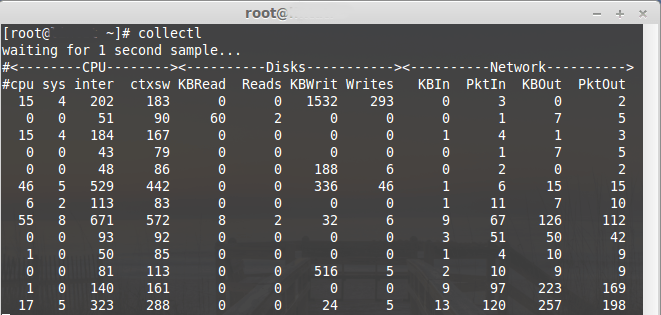
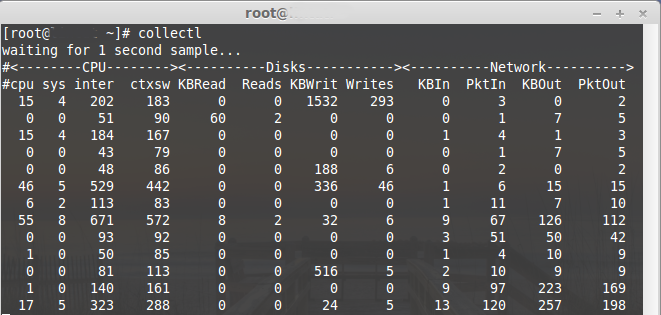
The cpu usage, disk io, and network activity is being logged every second. The data is not difficult to read for those who understand it. The list keeps growing at a defined time interval and is easily loggable to a file. And collectl provides necessary options to record, search and do other useful things with the data.
Monitor cpu usage
To monitor just the summary of cpu usage use “-sc”
# collectl -sc
waiting for 1 second sample...
#
#cpu sys inter  ctxsw
  61  12   680    671
  68   9   760    494
  44   8   528    537
  29   6   420    555
   0   0    89    117
   0   0   103    122
   0   0    74    101
   0   0    73    117
To observe each cpu individually, use “C”. It will output multiple lines together, one for each cpu.
# collectl -sC
waiting for 1 second sample...

# SINGLE CPU STATISTICS
#   Cpu  User Nice  Sys Wait IRQ  Soft Steal Idle
      0     0    0    0    0    0    0     0  100
      0     0    0    0    0    0    0     0  100
      0     0    0    0    0    0    0     0  100
      0    28    0    8    0    0    0     0   63
      0     0    0    0    0    0    0     0  100
      0     0    0    0    0    0    0     0  100
      0     0    0    0    0    0    0     0   99
Memory monitoring
Use the m subsystem to check the memory
# collectl -sm
waiting for 1 second sample...
#
#Free Buff Cach Inac Slab  Map
 122M  54M 374M 157M  63M 399M
 122M  54M 374M 157M  63M 399M
 123M  54M 374M 157M  63M 399M
 123M  54M 374M 157M  63M 399M
 123M  54M 374M 157M  63M 399M
 123M  54M 374M 157M  63M 399M
The M option would give further details about the memory.
# collectl -sM
waiting for 1 second sample...

# MEMORY STATISTICS
# Node    Total     Used     Free     Slab   Mapped     Anon   Locked    Inact   Hit%
     0    1023M  924224K  123952K   65328K   53740K  169484K        0  192188K 100.00
     0    1023M  924168K  124008K   65260K   53740K  169488K        0  192188K 100.00
     0    1023M  924168K  124008K   65264K   53740K  169488K        0  192188K 100.00
     0    1023M  924168K  124008K   65264K   53740K  169488K        0  192188K 100.00
     0    1023M  924168K  124008K   65264K   53740K  169488K        0  192188K 100.00
     0    1023M  924152K  124024K   65228K   53740K  169488K        0  192188K 100.00
     0    1023M  924136K  124040K   65212K   53740K  169488K        0  192188K 100.00
     0    1023M  924136K  124040K   65212K   53740K  169488K        0  192188K 100.00
Check disk usage
The d and D options provide the summary and details on disk usage.
# collectl -sd
waiting for 1 second sample...
#
#KBRead  Reads KBWrit Writes
      0      0      0      0
      0      0      0      0
      0      0     96      4
      0      0      0      0
      0      0      0      0
# collectl -sD
waiting for 1 second sample...

# DISK STATISTICS (/sec)
#           Pct
#Name       KBytes Merged  IOs Size  KBytes Merged  IOs Size  RWSize  QLen  Wait SvcTim Util
vda              0      0    0    0       0      0    0    0       0     0     0      0    0
vda              0      0    0    0       0      0    0    0       0     0     0      0    0
vda              0      0    0    0       0      0    0    0       0     0     0      0    0
vda              0      0    0    0       8      0    2    4       4     2     3      1    0
vda              0      0    0    0       0      0    0    0       0     0     0      0    0
For more information view collectl help system:
# collectl --help