Best command line tools for linux performance monitoring
Sometimes a system can be slow and many reasons can be the root cause. To identify the process that is consuming memory, disk I/O or processor capacity you need to use tools to see what is happening in an operation system.
There are many tools to monitor a GNU/Linux server. In this article, I am providing 7 monitoring tools and i hope it will help you.
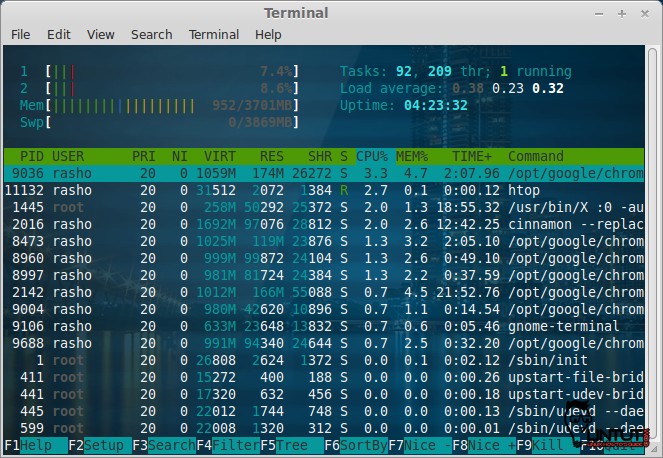
Htop
Htop is an alternative of top command but it provides interactive system-monitor process-viewer and more user friendly output than top.
htop also provides a better way to navigate to any process using keyboard Up/Down keys as well as we can also operate it using mouse. For Check our previous post: How to install and use htop on RHEL/Centos and Fedora linux
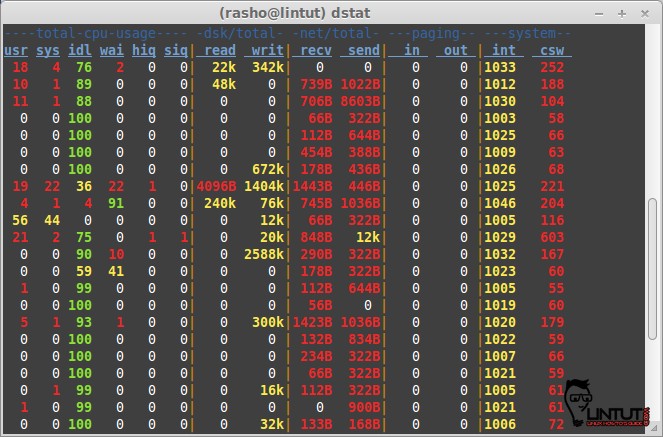
dstat
Dstat is a versatile replacement for vmstat, iostat, netstat and ifstat. Dstat overcomes some of their limitations and adds some extra features, more counters and flexibility. Dstat is handy for monitoring systems during performance tuning tests, benchmarks or troubleshooting.
Dstat allows you to view all of your system resources in real-time, you can eg. compare disk utilization in combination with interrupts from your IDE controller, or compare the network bandwidth numbers directly with the disk throughput (in the same interval).
Dstat gives you detailed selective information in columns and clearly indicates in what magnitude and unit the output is displayed. Less confusion, less mistakes. And most importantly, it makes it very easy to write plugins to collect your own counters and extend in ways you never expected.
Dstat’s output by default is designed for being interpreted by humans in real-time, however you can export details to CSV output to a file to be imported later into Gnumeric or Excel to generate graphs.
Check our previous post: How to install and use dstat on RHEL/CentOS,Fedora and Debian/Ubuntu based distribution
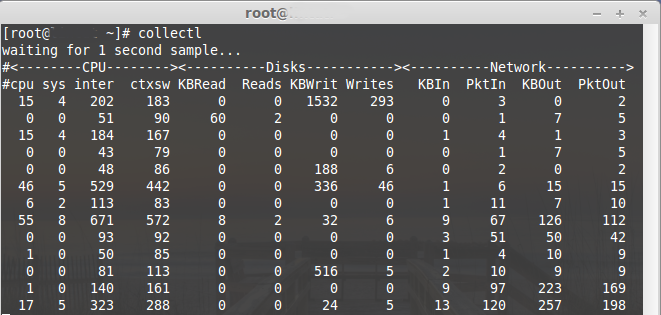
Collectl
Collectl is a light-weight performance monitoring tool capable of reporting interactively as well as logging to disk. It reports statistics on cpu, disk, infiniband, lustre, memory, network, nfs, process, quadrics, slabs and more in easy to read format.
In this article i will show you how to install and sample usage Collectl on Debian/Ubuntu and RHEL/Centos and Fedora linux.
Check our previous post: Collectl – Monitoring system resources
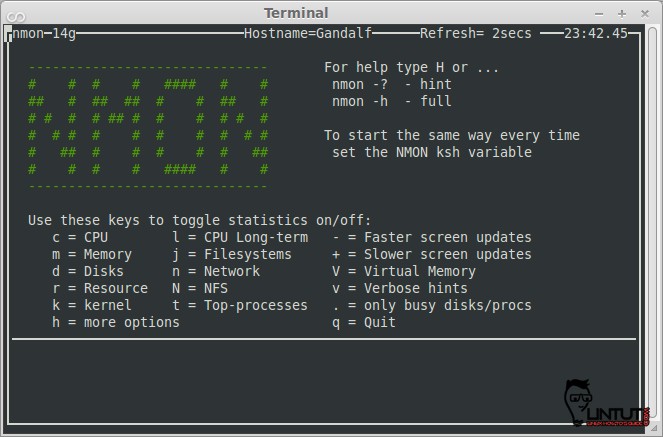
Nmon
nmon is a beutiful tool to monitor linux system performance. It works on Linux, IBM AIX Unix, Power,x86, amd64 and ARM based system such as Raspberry Pi. The nmon command displays and recordslocal system information. The command can run either in interactive or recording mode.
Check our previous post: Nmon – linux monitoring tools
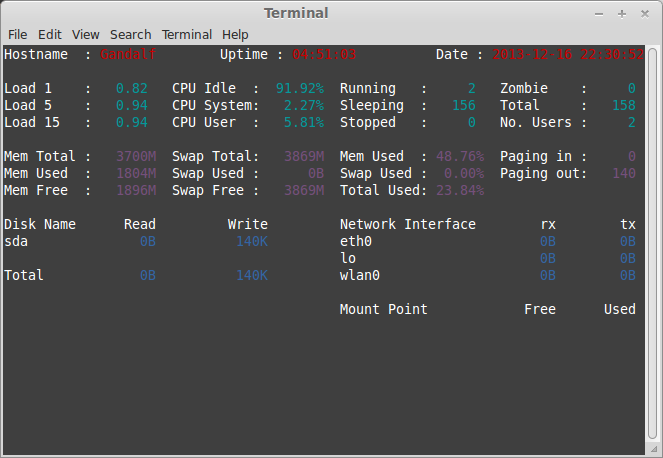
Saidar
Saidar is a curses-based application to display system statistics. It use the libstatgrab library, which provides cross platform access to statistics about the system on which it’s run. Reported statistics includeCPU, load, processes, memory, swap, network input and output and disks activities along with their free space.
Check our previous post: Saidar – system monitoring tool
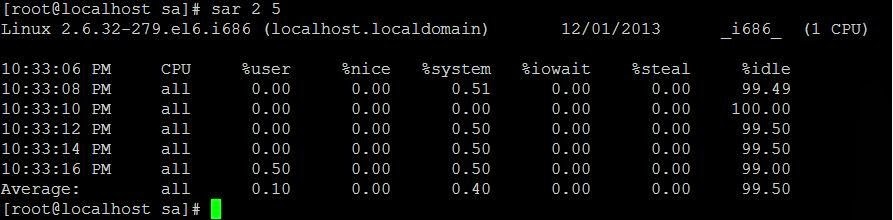
Sar
The sar utility, which is part of the systat package, can be used to review history performance data on your server. System resource utilization can be seen for given time frames to help troubleshoot performance issues, or to optimize performance.
Check our previous post: Using Sar To Monitor System Performance
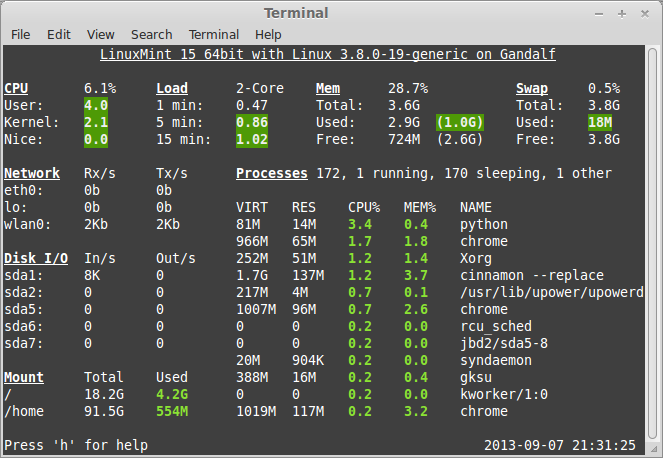
Glances
Glances is a cross-platform curses-based command line monitoring tool writen in Python which use the psutil library to grab informations from the system. Glance monitoring CPU, Load Average, Memory, Network Interfaces, Disk I/O, Processesand File System spaces utilization.
Glances can adapt dynamically the displayed information depending on the terminal siwrize. It can also work in a client/server mode for remote monitoring.
Check our previous post: Glances – Real Time System Monitoring Tool for Linux
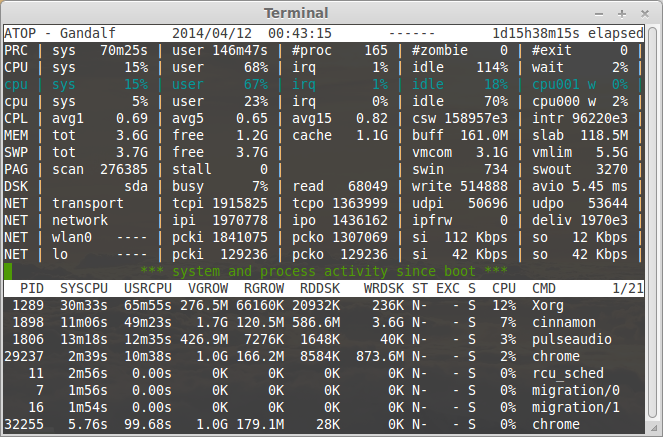
Atop
Atop is an interactive monitor to view the load on a Linux system. It shows the occupation of the most critical hardware resources on system level, i.e. cpu, memory, disk and network. It also shows which processes are responsible for the indicated load with respect to cpu- and memory load on process level. Disk load is shown if per process “storage accounting” is active in the kernel or if the kernel patch ‘cnt’ has been installed. Network load is only shown per process if the kernel patch ‘cnt’ has been installed.
For more about Atop check next post: Atop – monitor system resources in linux
So, if you come across any other similar tool then let us know in the comment box below.


aTop – http://www.atoptool.nl/
Where it shines compared to others is that it can keep a record of the activities of all processes and allow you to go back and see what the system state was.
There is cloud-based service SeaLion (https://sealion.com) which executes many of these commands by default and others can be added/modified to see output of commands on beautiful web-interface.
crap. I can’t even type ‘linux’ right. (and the popups came out again…)