Atop – monitor system resources in Linux
Atop is an interactive monitor to view the load on a Linux system. It shows the occupation of the most critical hardware resources on system level, i.e. cpu, memory, disk and network. It also shows which processes are responsible for the indicated load with respect to cpu- and memory load on process level. Disk load is shown if per process “storage accounting” is active in the kernel or if the kernel patch ‘cnt’ has been installed. Network load is only shown per process if the kernel patch ‘cnt’ has been installed.
The command atop has some major advantages compared to other performance monitoring tools:
- Resource consumption by all processes
- Utilization of all relevant resources
- Permanent logging of resource utilization
- Highlight critical resources
- Scalable window width
- Resource consumption by individual threads
- Watch activity only
- Watch deviations only
- Accumulated process activity per user
- Accumulated process activity per program
- Network activity per process
Install atop on RHEL/CentOS and Fedora linux
First you need to enable EPEL or RPMForge repository as described here to install atop. Type the following yum command:
# yum -y install atop
Install Atop on Debian/Ubuntu and Mint linux
Open your terminal and enter following command:
# sudo apt-get install atop -y
How to use atop program
Type the following command as root user:
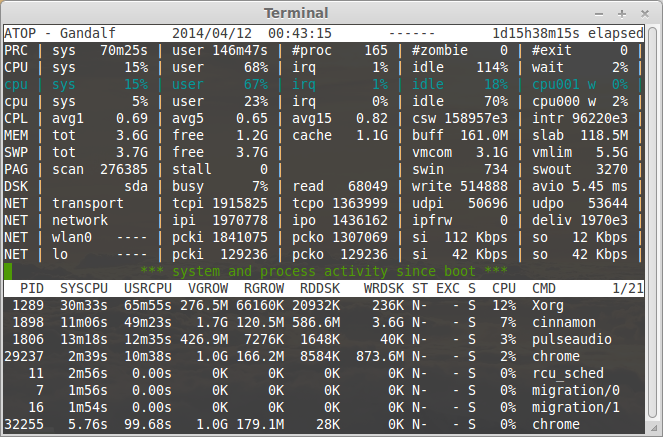
# atop
Example output:
To see active processes only
# atop -a
Display individual threads
# atop -y
Display average-per-second i.s.o. total values
# atop -1
Display memory-related process-info
# atop -m
Display disk-related process-info
# atop -d
Display network-related process-info
# atop -n
Display scheduling-related process-info
# atop -s
Display various process-info (ppid, user/group, date/time)
# atop -v
Display command line per process
# atop -c
Sorting option
Pass the following option to sort your process:
-C sort processes in order of cpu-consumption (default)
-M sort processes in order of memory-consumption
-D sort processes in order of disk-activity
-N sort processes in order of network-activity
-A sort processes in order of most active resource (auto mode)
For more information about Atop see man page:
# man atop
That is all!
See also: Best command line tools for linux performance monitoring


I like htop. Even more so when you spice up bash with multicolor. Makes the meters at the top dance as I stress the system lol.
htop does not have disk monitoring.