
Linux system monitoring remains a crucial discipline for any system administrator managing production servers in 2026. With increasing complexity, distributed architectures, and high uptime expectations, having the right Linux monitoring tools at your disposal isn’t a luxury—it’s an operational necessity. Whether you’re working with Debian, Ubuntu, RHEL, CentOS, or Arch Linux, free and actively maintained monitoring solutions can provide deep insight into CPU, memory, disk, network, and process health. This article dives into the most reliable and widely used Linux monitoring tools available today, explaining what they do, why they matter, and how they fit into real-world system administration workflows.
Understanding Critical Linux System Metrics
Before selecting or deploying any monitoring tool, it’s vital to understand what system metrics truly reflect your server’s health and performance. In my 15+ years running Linux infrastructure, I’ve learned that effective monitoring focuses on a targeted subset of these metrics to isolate issues accurately and quickly:
- CPU Utilization: Watch user/system CPU percentages and especially iowait to detect disk bottlenecks.
- Memory Usage: Look beyond simple free RAM by monitoring swap usage, page faults, and cache growth.
- Disk I/O: Latency and I/O queue depth often reveal real causes behind “slow server” complaints.
- Network Throughput: RX/TX rates plus packet drops are crucial to spotting network-induced lags.
- Load Average: Sustained load higher than CPU cores usually means the system is overloaded.
- Filesystem Usage: Keeping an eye on disk and inode consumption avoids unexpected full-disk outages.
- Process Health: Monitoring whether key services are up and their resource consumption prevents silent failures.
These metrics form the foundation of any Linux performance monitoring strategy and help you understand the “why” behind alerts, not just the “what.”
Using top for Real-Time Linux System Monitoring
One of the first tools any Unix/Linux sysadmin learns is top. It’s the default CPU and process monitoring command in almost every Linux distribution and works well even when systems are heavily stressed. In real-world production environments, I still lean on top for an instant look at which processes are consuming resources.
top

top - 15:22:04 up 20 days,  2:10,  2 users,  load average: 0.15, 0.10, 0.05
Tasks: 121 total,   1 running, 120 sleeping,   0 stopped,   0 zombie
%Cpu(s):  2.0 us,  1.0 sy,  0.0 ni, 96.5 id,  0.5 wa,  0.0 hi,  0.0 si,  0.0 st
MiB Mem :  7931.1 total,  1023.4 free,  5240.6 used,  1667.1 buff/cache
MiB Swap:  2048.0 total,  2048.0 free,     0.0 used.  2093.0 avail Mem

  PID USER      PR  NI    VIRT    RES    SHR S  %CPU %MEM     TIME+ COMMAND
 1423 root      20   0  301.6m  17.1m  10.5m S   4.0  0.2  12:43.12 containerd
 2031 ubuntu    20   0  581.8m  31.2m  10.0m S   2.0  0.4  10:15.67 dockerd
 5147 ubuntu    20   0  697.4m 125.4m  39.3m S   1.0  1.6   7:30.10 mysqld
The command displays current processes sorted by CPU usage, memory stats, uptime, and load averages for 1, 5, and 15 minutes. No historical data or alerting here, but in an incident, this tool is the first stop to isolate runaway processes and resource hogs.
Why htop Wins for Interactive Process Exploration
htop improves on top in usability by providing color-coded bars, process trees, and interactive controls. I use htop daily to navigate complex process hierarchies, spot processes causing memory leaks, and quickly kill errant jobs—all without typing commands line-by-line.
htop

  PID USER      PRI  NI  VIRT   RES   SHR S CPU% MEM%   TIME+  Command
 1423 root       20   0 301.6M 17.1M 10.5M S  4.0  0.2 12:43.12 containerd
 2031 ubuntu     20   0 581.8M 31.2M 10.0M S  2.0  0.4 10:15.67 dockerd
 5147 ubuntu     20   0 697.4M 125.4M 39.3M S  1.0  1.6  7:30.10 mysqld
The process tree view is excellent for understanding parent-child relationships—critical when debugging service managers spawning multiple workers. Its user-friendly interface reduces troubleshooting time, especially during high-stress situations where clarity matters most.
Deep Linux Performance Insights Using vmstat and iostat
One lesson learned in my years managing production servers: performance problems aren’t always where you expect. When users complain about slow applications but CPU usage looks normal, the root cause often lies in disk I/O bottlenecks. Tools like vmstat and iostat provide brutally honest, granular views of system-level memory, swap, and disk operations.
vmstat 5

procs -----------memory---------- ---swap-- -----io---- -system-- ------cpu-----
 r  b   swpd   free   buff  cache   si   so    bi    bo   in   cs us sy id wa st
 0  0      0 1048576 170000 400000    0    0     2     3    5   15  1  0 97  2  0
 1  0      0 1048000 170100 399800    0    0     0     0  101  205  3  1 95  1  0
vmstat reports memory usage, swap activity, and CPU wait time (wa), helping admins spot when excessive swapping or I/O waits degrade service responsiveness.
iostat -xz 5

Linux 5.15.0 (hostname)   06/25/2026

Device            r/s     w/s     rkB/s   wkB/s   rrqm/s  wrqm/s  r_await  w_await  svctm  %util
sda               20      10      1600    800     1       2       5.1      3.2      1.2    3.6
sdb                0       0        0      0      0       0       0.0      0.0      0.0    0.0
iostat focuses on disk I/O, showing read/write throughput and latency. Both of these tools require interpretation experience but are invaluable for pinpointing slow disk subsystems causing performance drag.
Fast Overviews with Glances
In day-to-day monitoring, when you want a quick, holistic snapshot of system health without opening a dozen terminals, Glances shines. It aggregates CPU, memory, disk, network, sensors, and process stats into a unified terminal interface, colored to highlight issues and reduce cognitive load.
glances

CPU      12% [||||      ]  MEM      45% [||||||||||      ]  SWAP     5% [||          ]
Disk I/O  0.2 MB/s (read)  0.1 MB/s (write)

Processes:
PID   USER     CPU%   MEM%   COMMAND
1423  root      4.0    0.2   containerd
2031  ubuntu    2.0    0.4   dockerd
5147  ubuntu    1.0    1.6   mysqld
Glances is especially handy during incident responses for a fast health check or when monitoring a smaller set of servers without the overhead of complex dashboards.
Real-Time Visual Monitoring with Netdata
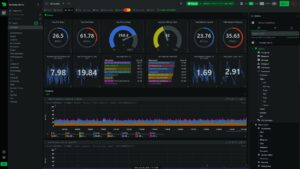
For admins who want rich, real-time performance visualization accessible via browser, Netdata is a top pick. It auto-discovers metrics from CPU cores, memory, disks, networking, and many common services out of the box. Netdata’s per-second granularity and immediate setup make it the go-to in urgent troubleshooting sessions.
Though it requires a graphical front end (browser), Netdata’s detailed insights into system and application metrics often reveal precise bottlenecks that simpler CLI tools miss.
Long-Term, Scalable Monitoring with Prometheus and Grafana
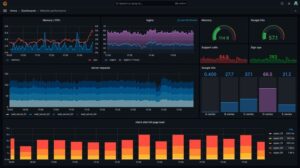
When managing multiple systems or a growing fleet in production, collecting and analyzing historical data becomes critical. Prometheus paired with Node Exporter provides the backbone for this, gathering a wealth of Linux system metrics that you can query with PromQL to understand trends and trigger alerts based on real conditions.
Coupling Prometheus with Grafana’s dashboarding capabilities allows teams and stakeholders to visually track metrics over time, detect slow resource leaks, and produce actionable reports for decision making. Setting these up requires investment but pays off with operational confidence at scale.
Lightweight Service Monitoring with Monit
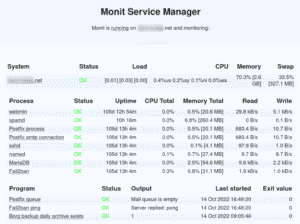
Not every server needs complex monitoring. For single critical servers, Monit acts as a watchdog that checks health, resource usage, and disk space, automatically restarting services if they fail. In real production troubleshooting, I have frequently used Monit to provide quick auto-recovery on database or web services before the problem escalated.
When to Choose Which Tool
There’s no “silver bullet” monitoring tool. The best Linux monitoring setups are layered, combining tools serving different purposes:
- For immediate, on-the-fly troubleshooting:
top,htop, orbtopprovide instant resource snapshots with minimal setup. - Diagnosing disk or memory issues:
vmstatandiostatreveal system-level bottlenecks hidden beneath CPU metrics. - Rapid health overview:
GlancesorNetdatagive comprehensive information with easy access. - Automated service recovery:
Monitensures critical processes stay alive without human intervention. - Visual browser-based monitoring:
CockpitandNetdataprovide system stats and lightweight management interfaces. - Enterprise-scale monitoring & alerting:
Prometheus + Grafanaform the industry standard for multi-server, long-term trend analysis.
Best Practices for Linux Monitoring in Production
Based on years managing critical Linux infrastructure, these practices consistently improve monitoring effectiveness:
- Start simple and build up: Know which core metrics matter. Avoid overwhelming with too many graphs.
- Understand benchmark baselines: Regularly record healthy state metrics to detect abnormal deviations.
- Combine real-time and historical views: Instant CLI commands for incident response, dashboards for trending.
- Implement alerting wisely: Alert only on actionable thresholds to avoid noise and alert fatigue.
- Test auto-recovery tools in a staging environment: Trust but verify any auto-restarts or failovers before production use.
- Train your team on metric meaning: A tool is only as good as your ability to interpret its output effectively.
Real-World Troubleshooting Scenario: Diagnosing a ‘Slow Server’ Complaint
In one case, users reported extreme slowness on a database server, but initial top checks showed CPU idling around 10%. Jumping to vmstat, I noticed constant high iowait (over 30%), confirming the CPU was waiting on disk operations. Running iostat highlighted one disk device with average service time (svctm) spiking over 40ms—a clear disk bottleneck.
Further investigation revealed failing drives in a RAID array causing retries and slow I/O. The quick switch to replacement drives resolved the issue long before application timeouts impacted customers. This incident underlined why Linux admins must dig deeper than CPU and memory metrics when performance degrades.
Conclusion
Choosing the best Linux monitoring tools in 2026 requires matching the right tool to your operational goals. Whether you need fast CLI snapshots with top and htop, hardware-level honesty from vmstat and iostat, or scalable, alert-driven setups using Prometheus and Grafana, these free tools form the backbone of robust Linux system management. Remember, effective monitoring is about gaining actionable insight—not dazzled by dashboards alone. Start with essential metrics, keep systems visible, and react before problems ever reach your users.