Nmon – linux monitoring tools
nmon is a beutiful tool to monitor linux system performance. It works on Linux, IBM AIX Unix, Power, x86, amd64 and ARM based system such as Raspberry Pi. The nmon command displays and records local system information. The command can run either in interactive or recording mode.
Nmon is a short for Nigel’s performance Monitor. This tool is used to monitor resources on Linux, Power, x86, x86_64, Mainframe and ARM (Raspberry Pi). There are two mode available of nmon.
1. Online Mode, which used to real-time monitoring.
2. Capture Mode, which the output will saved to a CSV file for later processing
Features
- There are two modes available:
- In Online Mode it uses curses for efficient screen handling, which updates the terminal frequently for real-time monitoring.
- In Capture Mode, the data is saved to a file in CSV format for later processing and graphing. The file also includes important configuration details that are useful for recommending tuning.
- nmon concentrates on performance information for the performance tuner and in a concise layout to aid understanding. This includes: CPU, memory, disks, adapters, networks, NFS, Kernel statistics, File-systems, Workload Manger (AIX), Workload Partitions (AIX) and Top Processes.
- nmon includes support for older AIX releases, Linux running on x86, POWER and Mainframe platforms.
Install nmon on Ubuntu 12.04/12.10/13.04/13.10/14.04 and Linux Mint 13/14/15/16
To install nmon on Ubuntu 12.04/12.10/13.04/13.10/14.04 and Linux Mint 12/13/14/15/16 enter following command:
# sudo apt-get install nmon
Install nmon on RHEL/CentOS 5.x/6.x and Fedora 16/17/18/19/20
First, install rpm forge repository and enter folloving command:
# yum install nmon
How do I use nmon?
Simply type the following command:
# nmon
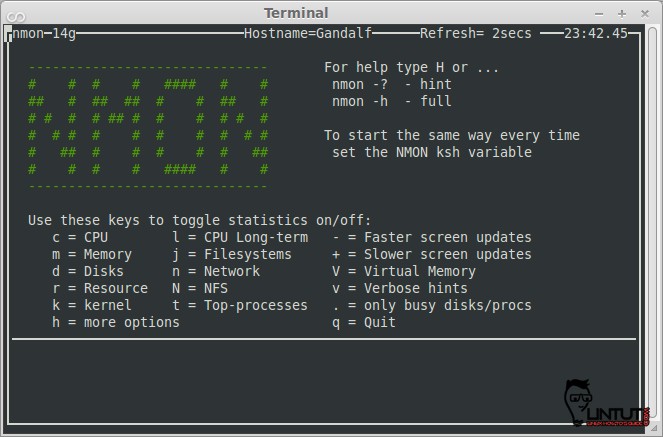
nmon keyboard shortcuts
- q – To stop and exit nmon.
- h – To see quick help (hint) screen and press h again to remove the hints.
- Use the following command to turn on or off stats:
- c – See cpu stats.
- m – See memory stats.
- d – See disk stats.
- k – See kernel stats.
- n – See network stats.
- N – See NFS stats.
- j – See file system stats.
- t – See top process.
- V – See virtual memory stats.
- . – See only busy disks/procs.
- v – Verbose mode (display as Ok/warning/danger on screen).
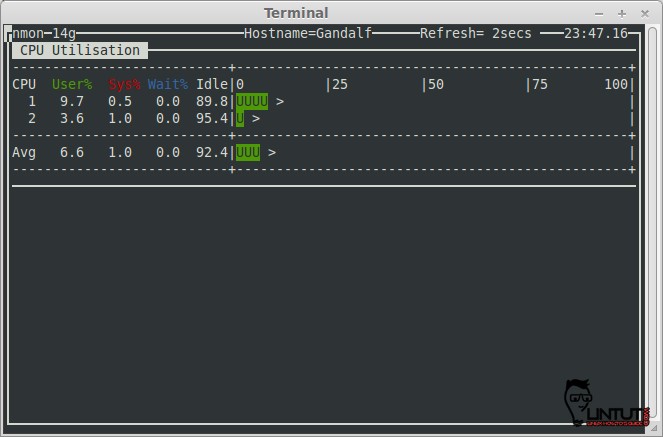
Check CPU by processor
If you like to collect CPU performance statistics press “c” key on your keyboard. After hitting the “c” see example screen:
If you see information of another system resources press another keys:
- m = Memory
- j = Filesystems
- d = Disks
- n = Network
- V = Virtual Memory
- r = Resource
- N = NFS
- k = kernel
- t = Top-processes
- . = only busy disks/procs
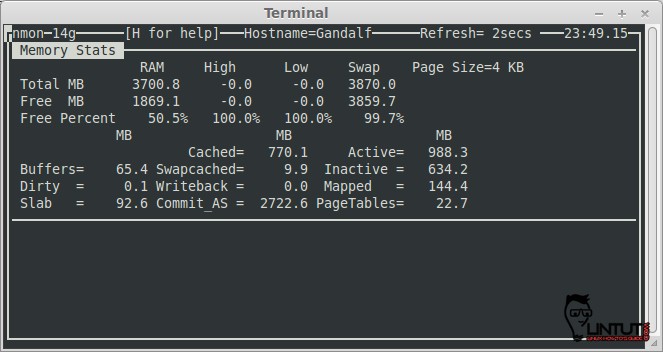
Show Memory stats
Use the ‘m‘ key to get Memory Stats information:
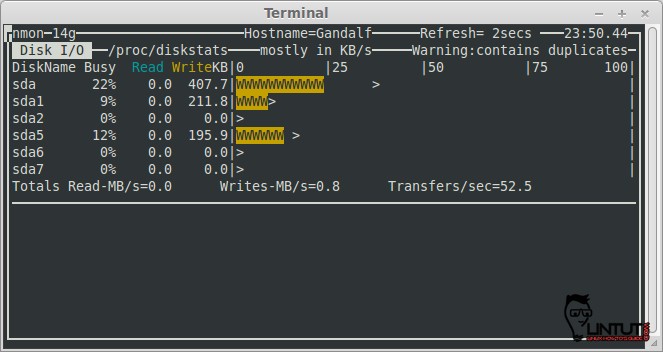
Check Disk I/O stats
To see Disk I/O information press “d” key on your keyboard
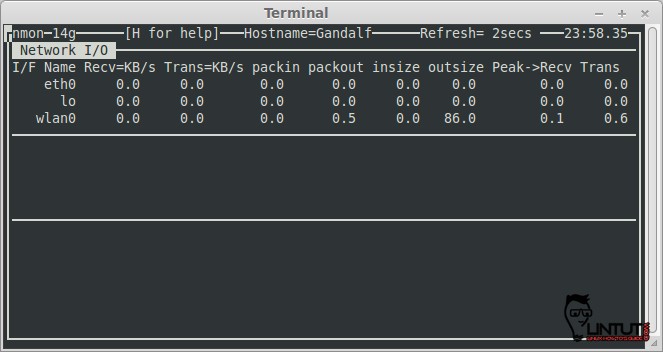
Check Network statistics
To see network statistics press “n” key on your keyboard
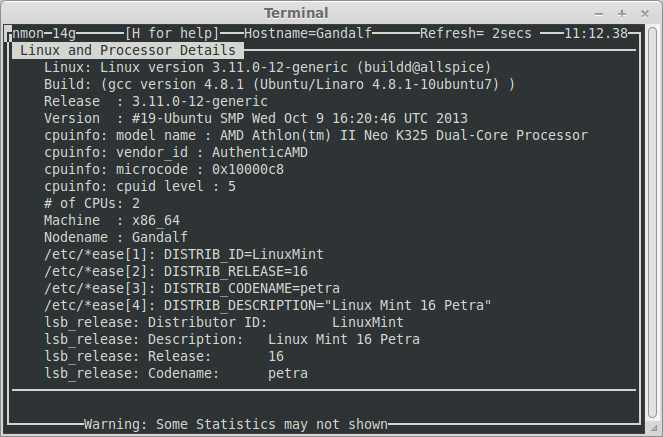
Nmon System information
Use the ‘r‘ key to show System information:
If you are having any suggestion, let me know via our comment section.
See also: Collectl – Monitoring system resources


Great tutorial, hope you dont mind linking to your website. Thanks.
Thanks.
It’s much better organized than top
Hi,
Thanks,
very nice article……