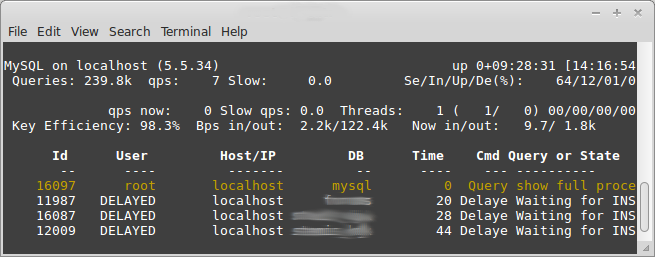
Monitor MySql database using mytop command line monitoring tool
Mytop is a free and open source command line monitoring software for MySQL databases. Its similar in look to “top” command in Linux/Unix. Mytop monitors MySQL threads and the database’s overall performance, allowing system administrators or developers to get some insight on how applications are interacting with a database.
Install Mytop on RHEL/CentOS and Fedora linux
Mytop is included in the Fedora repositories, so it is just a yum install away. If you are using Red Hat Enterprise Linux or CentOS, mytop is available via the RPMForge repository.
Now install the Mytop package:
# yum install mytop -y
Monitor Databases
Now, run the following command to open the Mytop tool. It will ask the mysql root password to monitor the databases:
# mytop --prompt

If you want to monitor a particular database, use the parameter -d. For example, to monitor the database called “example_database” enter the following command:
# mytop --prompt -d example_database
Shortcut Keys
The following keys perform various actions while mytop is running. Those which have not been implemented are listed as such. They are included to give the user idea of what is coming.
? Display help.
c Show “command counters” based on the Com_* values in SHOW STATUS. This is a new feature. Feedback welcome.
d Show only threads connected to a particular database.
f Given a thread id, display the entire query that thread was (and still may be) running.
F Disable all filtering (host, user, and db).
h Only show queries from a particular host.
H Toggle the header display. You can also specify either header=0 or header=1 in your config file to set the default behavior.
i Toggle the display of idle (sleeping) threads. If sleeping threads are filtered, the default sorting order is reversed so that the longest running queries appear at the top of the list.
k Kill a thread.
m Toggle modes. Currently this switches from `top’ mode to `qps’ (Queries Per Second Mode). In this mode, mytop will write out one integer per second. The number written reflects the number of queries executed by the server in the previous one second interval.
More modes may be added in the future.
o Reverse the default sort order.
p Pause display.
q Quit mytop
r Reset the server’s status counters via a FLUSH STATUS command.
s Change the sleep time (number of seconds between display refreshes).
u Show only threads owned by a giver user.
Thats it. Refer the official documentation page for more information about Mytop.

